In the past, many marketing departments relied on their media vendors and agencies to help them measure marketing effectiveness. If you wanted to know how successful a television advertisement was, for example, you’d request a report from the network and mull over the results for a few days.
While these partnerships are still fruitful, they leave something to be desired. Namely, marketers have realized they leave serious gaps when it comes to brand and person-level measurement. This has inspired organizations across industries to grow their in-house marketing capabilities to become more self-reliant and advance their approach to marketing analytics.
As a provider of advanced marketing decision analytics, Marketing Evolution is perfectly positioned to help organizations identify their target audience, study customer behavior in-depth, and provide actionable recommendations to improve your strategy. To illustrate how we’re helping businesses succeed, let’s take a closer look at the most powerful attribution capabilities Marketing Evolution has to offer.

Customer Journey Insights
This window gives you access to three different analytical models: Sequencing, channel interactivity, and conversion report. Each of these will provide a different visualization of the path consumers took to reach your desired KPI.
Depending on your preference, this can be a single KPI, such as sales, newsletter signups, or visits from a branded keyword. Alternatively, you can use multi-KPI optimization to measure several at once.
Let’s take a closer look at each model in the Customer Journey Insights window.
Sequencing Report
The sequencing report allows you to see which touchpoints a consumer interacted with from first to last touch, and how frequently these interactions occurred. Here’s a snapshot from one of our sample brands:
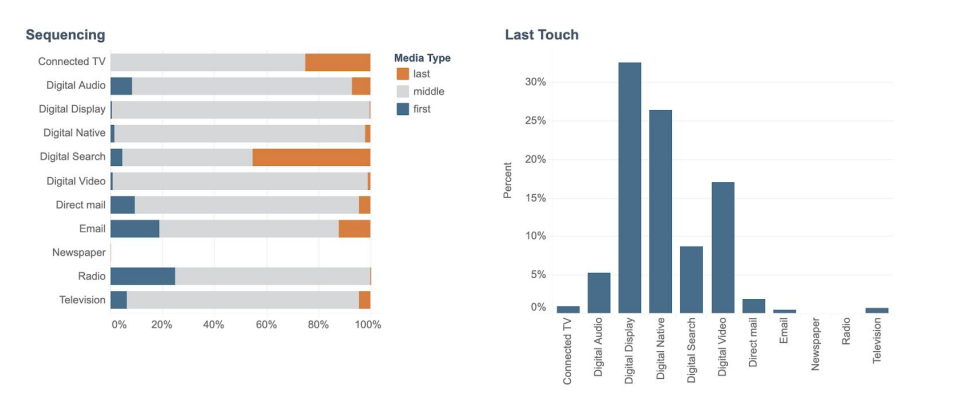
In the first chart, you can see how these touch points played into driving a conversion – for this sample marketing plan, you can see that while digital search was often the last step before conversion, other channels played a greater role in introducing customers to the brand.
In the second chart, you can see how frequently customers engaged with a channel. For instance, many customers interacted with digital display, digital native, and digital video ads for this campaign.
Channel Interactivity Report
The channel interactivity report allows you to see which cross-channel exposures are most effective. Here’s another sample:
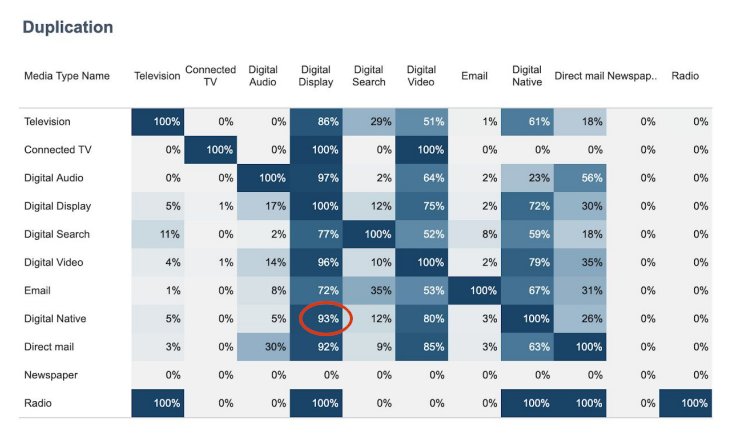
On this chart, you can see that 93 percent of customers who responded to native digital content also responded to digital display advertisements. These insights can be used to better curate the customer journey by predicting which touchpoints customers are most likely to engage with next.
Conversion Report
The conversion report is fairly straightforward – it helps you see how cross-channel exposures led to actual conversions. You can see how it works below:
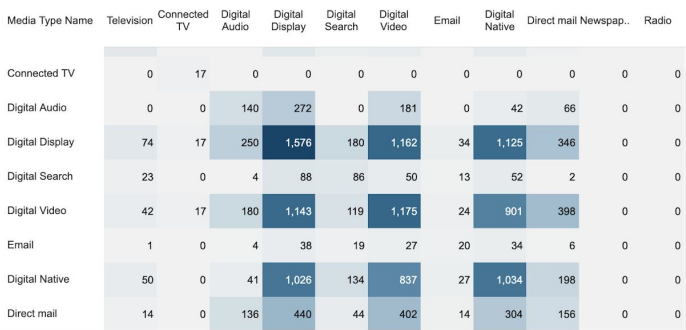
Reading this chart at a glance is fairly simple: The darker the shading, the more conversions those channels drove together. For example, combining native digital content with a digital display ad netted 1,125 conversions.
The outcome of each of these charts is simple, but very valuable: You’ll understand how all of your channels work together to encourage conversions.
Audience Insights
No two people respond the same way to a certain media placement. With Audience Insights, you can understand which customer segments like your messaging, helping you provide more precise targeting. For example: Do married or single people like your product? What level of education do they have? And how old are they?
Audience Insights breaks down your bulk engagement data – even from offline media – into information about a customer’s individual traits. Here’s one model you’ll see under this tab:
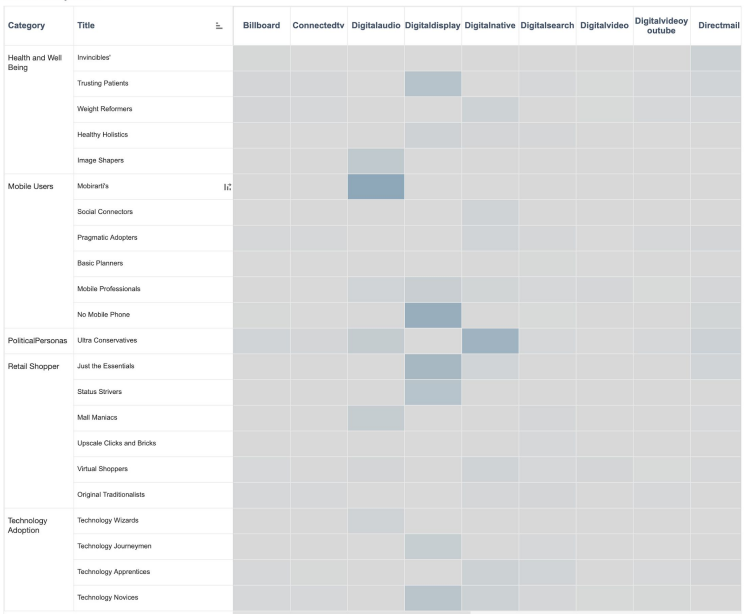
In the image provided, you can see how certain channels align with specific customer groups. The darker the shading is, the more responsive that segment is to your outreach on a given channel. It’s strongly beneficial to have this data, as you can more accurately predict who is engaging across channels.
Attribution Reporting
This function allows marketers to merge user and aggregate-level data into a single report, helping them illustrate the assigned value of each touchpoint in their campaign. Marketing Evolution takes a close look at a user’s path to purchase, taking into account every interaction and impression, then attributes a weighted value to each touchpoint. This report uses person-level data but is completely de-identified.
For example, we would start to assign value to a billboard ad by ingesting your market-level billboard investments. Then, we’d compare the total spend for that touchpoint against total impressions, while also considering your total market-level investments. Then, using predictive analytics, we can assign a weighted value on a touchpoint level.
In practice, this reporting function works by allowing you to choose a KPI and a date range. Then, our solution runs the analysis and gives you a CSV file. From there, you can further manipulate it with a program like Tableau or co-mingle it with data from other aspects of your business. Here’s an example of how that sheet would work:
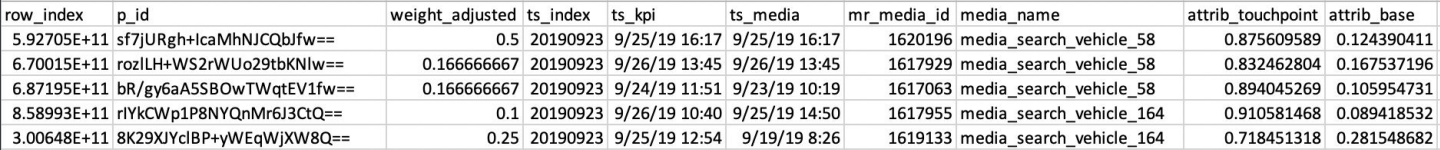
Overall, this function gives your data science and analytics team more data and information at their disposal. With this information in their hands, the only limit is their creativity. Think of it like a data sandbox.
Media Reporting
Media reporting is similar to attribution reporting, except it allows marketers to examine their media investments on an even deeper level. The key outcome of this function is providing actionable recommendations to optimize your strategy.
This means that instead of only understanding how a certain touchpoint influenced a sale, you’d also know if you’d benefit from adjusting your investment. This analysis can be run at a channel level or focus on gaining deep insights about individual marketing tactics or as placements. For instance, the Media Reporting function could determine if you’d drum up more sales by investing 25% of your television marketing spend into YouTube ads.
Here’s a sample of the outcomes you’d receive from this report:
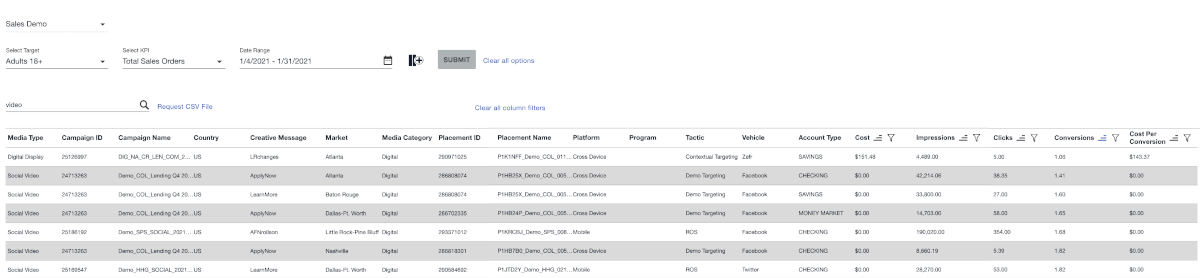
This report is bound to transform your approach to media mix optimization by providing data-driven, actionable recommendations to improve your strategy.
Conclusion
These four capabilities represent just a snapshot of what Marketing Evolution has to offer. We can also delve into insights about media investments and brand impact, as well as provide detailed scenario planning capabilities. Each of these functions are designed to work together to help marketers gain granular insight into all of their marketing investments without requiring assistance from a team of data scientists.
Interested in learning more about how our solution works? Schedule a demo with one of our solution experts today.