Marketing Evolution customers can gain a deeper understanding of their customers' path to purchase with our new Journey Visualizations, now live in the Insights Application.
One of the most challenging parts of putting user and touchpoint level attribution data to work within the marketing organization is the sheer scale of marketing data, which quickly grows to billions of touchpoints across millions of users. The Journey Visualizations cut through the noise to help users identify the signal: the most common journeys consumers take on their path to purchase, how media types show up differently in consumers' journeys, and more.
Here's what's new today.
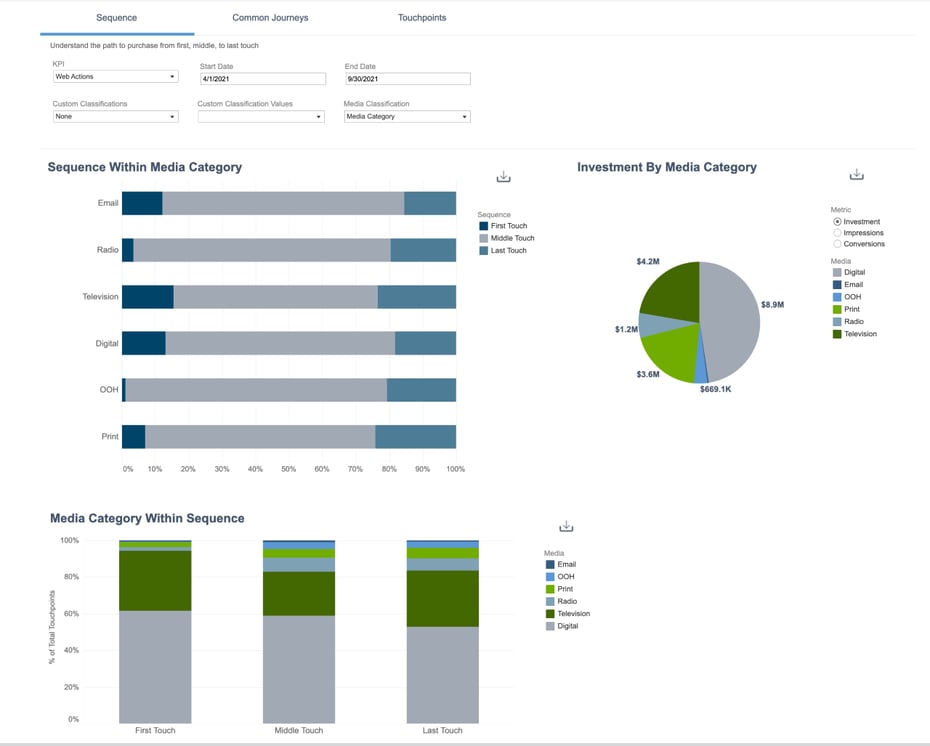
Sequence
Understand the path to purchase across media channels from first, middle, to last touch. See how sequence changes for different KPIs across the conversion funnel, compare the breakdown of touchpoints across conversions, impressions, and spend.
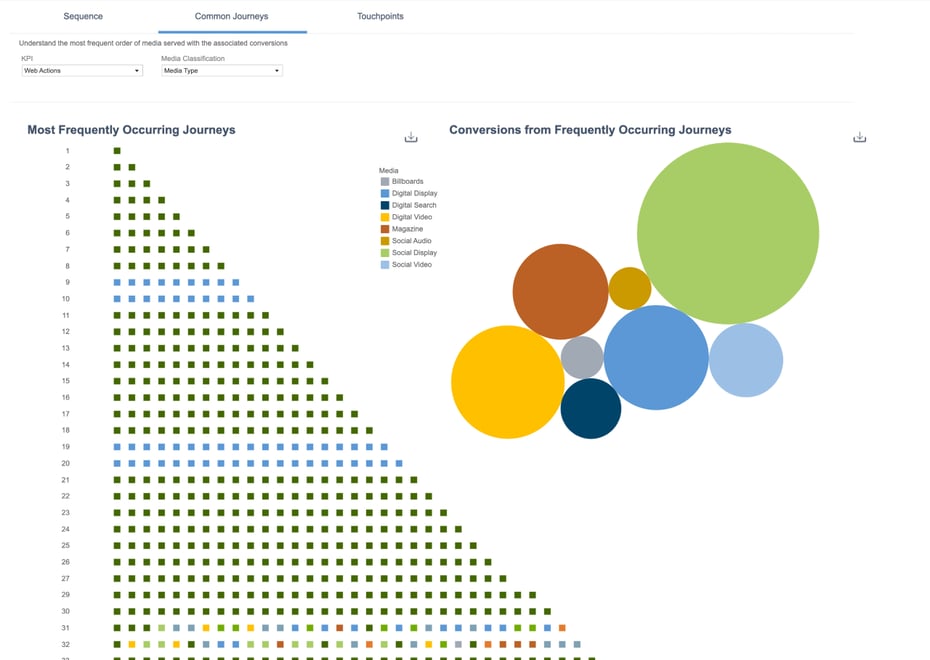
Common Journeys
Visualize the most frequently occurring customer journeys and observe these journeys vary as they increase in length and across KPIs. For each journey length, understand how the share of conversion credit varies across media types.
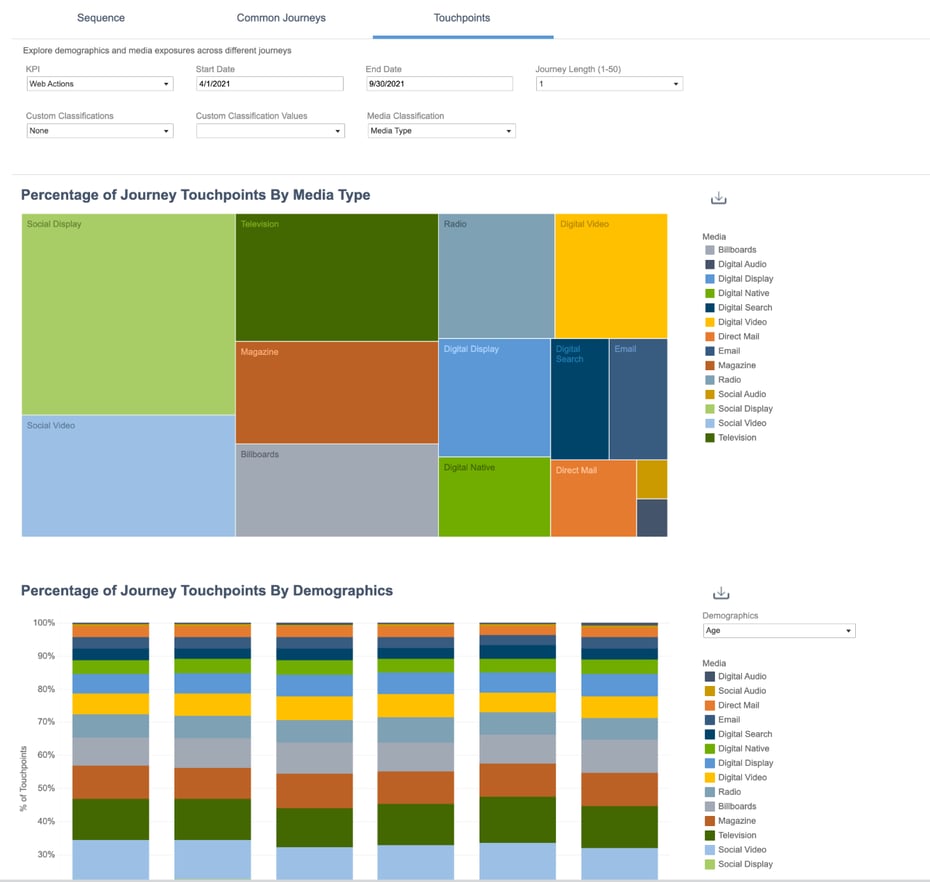
Touchpoints
Dive even further into consumer journey data to visualize how each journey breaks down to individual touchpoints, and how this varies with journey length and KPI. Understand how media exposure varies across user demographics.
Want to learn more about these new updates and see our platform in action? Book a meeting with us and let's chat.